개발/Javascript
[Javscript/Rechart] x축 스크롤링 추가
이나당
2025. 5. 3. 16:57
const CustomTick = (props) => {
  const { x, y, payload } = props
  const dateParts = payload.value.split('-') // ["2024", "12", "15"]

  return (
    <text
      x={x}
      y={y}
      textAnchor="front"
      fontSize={12}
      letterSpacing={-0.55}
      fontWeight={500}
      fill="#333"
    >
      <tspan x={x} dy="12">
        {dateParts[0]}년
      </tspan>
      <tspan x={x} dy="15">
        {dateParts[1]}월 {dateParts[2]}일
      </tspan>
    </text>
  )
}

const StatUsageStatus = ({ value }) => {
  ...코드생략
  // x축 간격 조정 (4rem)
  const chartWidth =
    Math.max(chartData?.length * 64, 800) >=
    document?.querySelector('.ChartWrap')?.offsetWidth
      ? Math.max(chartData?.length * 64, 800)
      : '100%'

  return (
    <StatTabPanel value={value} index={0} className="StatUsageStatus">
		...코드생략
        <Box className="ChartBox">
          <Box className="ChartContent">
            <ResponsiveContainer width={chartWidth} height="100%">
              <AreaChart
                width={'100%'}
                height={500}
                data={chartData}
                margin={{
                  top: 10,
                  right: 60,
                  left: 0,
                  bottom: 30,
                }}
              >
                {/* ✅ SVG 그라데이션 정의 */}
                <defs>
                  {/* userCount 그래디언트 */}
                  <linearGradient
                    id="userCountGradient"
                    x1="0"
                    y1="0"
                    x2="0"
                    y2="1"
                  >
                    <stop offset="0%" stopColor="#f1bd44" stopOpacity={0.5} />
                    <stop offset="100%" stopColor="#f1bd44" stopOpacity={0} />
                  </linearGradient>
                  <linearGradient
                    id="preReviewCountGradient"
                    x1="0"
                    y1="0"
                    x2="0"
                    y2="1"
                  >
                    <stop offset="0%" stopColor="#53a9eb" stopOpacity={0.5} />
                    <stop offset="100%" stopColor="#53a9eb" stopOpacity={0} />
                  </linearGradient>
                </defs>
                <CartesianGrid vertical={false} />
                <XAxis
                  dataKey="date"
                  interval={0}
                  tick={<CustomTick />}
                  tickLine={false}
                />
                <YAxis stroke="#333" tickLine={false} />
                <Tooltip />
                <Area
                  dataKey="preReviewCount"
                  dot={{ strokeWidth: 2, r: 1 }}
                  fill="url(#preReviewCountGradient)"
                  name="테스트수"
                  stroke="#53a9eb"
                />
                <Area
                  dataKey="userCount"
                  dot={{ strokeWidth: 2, r: 1 }}
                  fill="url(#userCountGradient)"
                  name="이용자 수"
                  stroke="#f1bd44"
                />
              </AreaChart>
            </ResponsiveContainer>
          </Box>
          <Box className="ChartLegends">
            <Box className="ChartLegend">
              <Box />
              <T>이용자 수</T>
            </Box>
            <Box className="ChartLegend">
              <Box />
              <T>테스트수</T>
            </Box>
          </Box>
        </Box>
    </StatTabPanel>
  )
}

export { StatUsageStatus }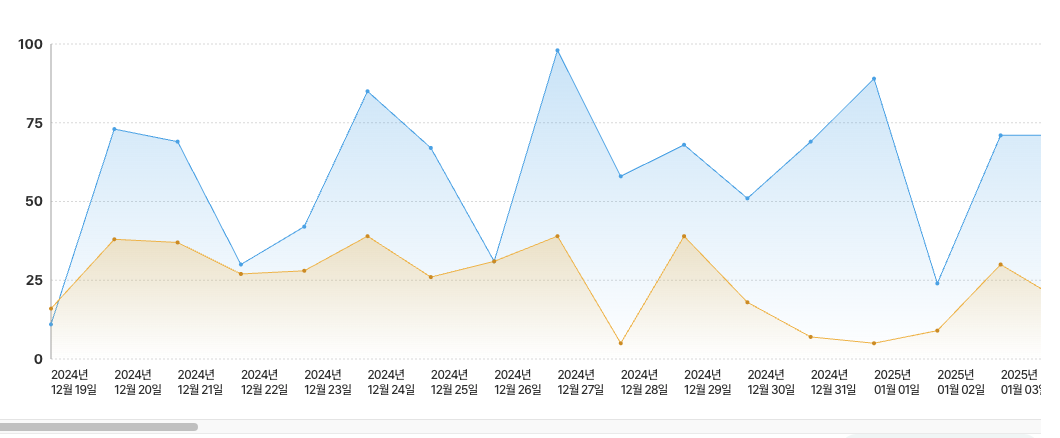
처음엔 전체 가로스크롤 되는 코드였는데, 디자인상으로는 길어지면 y축은 고정이고 x축만 스크롤이 되게 디자인이 나와있어서, 코드를 수정했다. 처음에 어떻게 할지 고민했는데 해당 라이브러리 깃 issue에 비슷한 고민 해결을 올려둔 분이 있어서 참고할 수 있었다.
const StatUsageStatus = ({ value }) => {
...코드생략
  return (
    <StatTabPanel value={value} index={0} className="StatUsageStatus">
      <Box className="ChartWrap">
		... 코드생략
        <Box className="ChartBox">
          <Box className="ChartContent">
            <Box className="ChartYAxis">
              <AreaChart
                width={62}
                height={400}
                data={chartData}
                margin={{
                  top: 10,
                  right: 0,
                  left: 0,
                  bottom: 65,
                }}
              >
                <YAxis stroke="#333" tickLine={false} />
                <Area
                  fillOpacity={0}
                  strokeOpacity={0}
                  dataKey="preReviewCount"
                />
                <Area fillOpacity={0} strokeOpacity={0} dataKey="userCount" />
              </AreaChart>
            </Box>
            <Box className="ChartXAxis">
              <ResponsiveContainer width={chartWidth} height="100%">
                <AreaChart
                  width={'100%'}
                  height={400}
                  data={chartData}
                  margin={{
                    top: 10,
                    right: 60,
                    left: 0,
                    bottom: 30,
                  }}
                >
                  {/* SVG 그라데이션 정의 */}
                  <defs>
                    {/* userCount 그래디언트 */}
                    <linearGradient
                      id="userCountGradient"
                      x1="0"
                      y1="0"
                      x2="0"
                      y2="1"
                    >
                      <stop offset="0%" stopColor="#f1bd44" stopOpacity={0.5} />
                      <stop offset="100%" stopColor="#f1bd44" stopOpacity={0} />
                    </linearGradient>
                    <linearGradient
                      id="preReviewCountGradient"
                      x1="0"
                      y1="0"
                      x2="0"
                      y2="1"
                    >
                      <stop offset="0%" stopColor="#53a9eb" stopOpacity={0.5} />
                      <stop offset="100%" stopColor="#53a9eb" stopOpacity={0} />
                    </linearGradient>
                  </defs>
                  <CartesianGrid vertical={false} />
                  <XAxis
                    dataKey="date"
                    interval={0}
                    tick={<CustomTick />}
                    tickLine={false}
                  />
                  <Tooltip />
                  <Area
                    dataKey="preReviewCount"
                    dot={{ strokeWidth: 2, r: 1 }}
                    fill="url(#preReviewCountGradient)"
                    name="테스트수"
                    stroke="#53a9eb"
                  />
                  <Area
                    dataKey="userCount"
                    dot={{ strokeWidth: 2, r: 1 }}
                    fill="url(#userCountGradient)"
                    name="이용자 수"
                    stroke="#f1bd44"
                  />
                </AreaChart>
              </ResponsiveContainer>
            </Box>
          </Box>
          <Box className="ChartLegends">
            <Box className="ChartLegend">
              <Box />
              <T>이용자 수</T>
            </Box>
            <Box className="ChartLegend">
              <Box />
              <T>테스트수</T>
            </Box>
          </Box>
        </Box>
      </Box>
    </StatTabPanel>
  )
}
      // recharts라이브러리 스타일
      .ChartContent {
        display: flex;
        height: dp(400);
        .ChartYAxis {
          width: dp(80);
          height: dp(400);
        }
        .ChartXAxis {
          overflow: hidden;
          overflow-x: auto;
          &::-webkit-scrollbar {
            height: dp(6);
          }

          &::-webkit-scrollbar-thumb {
            border-radius: dp(3);
            background: #aaa;
          }

          &::-webkit-scrollbar-thumb:hover {
            background: #aaa;
          }

          &::-webkit-scrollbar-track {
            background: #eee;
          }
          .recharts-responsive-container {
            .recharts-wrapper {
              .recharts-surface {
                // 차트 내 가로선
                .recharts-cartesian-grid {
                  .recharts-cartesian-grid-horizontal {
                    line {
                      stroke: #ddd;
                      stroke-dasharray: 2 2;
                    }
                  }
                }
                // 차트 내 도트
                .recharts-area {
                  &:first-child {
                    .recharts-area-dots {
                      circle {
                        stroke: #0b7cd3;
                      }
                    }
                  }
                  &:last-child {
                    .recharts-area-dots {
                      circle {
                        stroke: #d3970b;
                      }
                    }
                  }
                }
                // 차트 내 X축
                .recharts-xAxis {
                  .recharts-cartesian-axis-line {
                    stroke: #ddd;
                    stroke-width: dp(1);
                    stroke-dasharray: 2 2;
                  }
                  .recharts-cartesian-axis-ticks {
                    .recharts-cartesian-axis-tick {
                      text-align: left;
                      @include font(500, 12, 20, -0.55);
                    }
                  }
                }
                // 차트 내 Y축
                .recharts-yAxis {
                  .recharts-cartesian-axis-line {
                    stroke: #aaa;
                  }
                  .recharts-cartesian-axis-ticks {
                    @include font(bold, 14, 20);
                  }
                }
              }

              .recharts-tooltip-wrapper {
                .recharts-default-tooltip {
                  padding: dp(5) dp(10) dp(10) !important;
                  .recharts-tooltip-label {
                    @include font(600, 14, 24);
                  }
                  .recharts-tooltip-item-list {
                    .recharts-tooltip-item {
                      padding: 0 !important;
                      span {
                        @include font(bold, 14, 20);
                      }
                    }
                  }
                }
              }
            }
          }
        }
      }
Y축과 X축을 따로 분리하고 X축만 스크롤이 생기도록 div를 분리했다.
결과

참고
- https://recharts.org/en-US/api
- https://github.com/recharts/recharts/issues/1364#issuecomment-2608588147
반응형